Guide: How to use the Urban Typologies


Their purpose

The four Urban Typologies identify and connect regions and cities that share similar challenges and opportunities, and thus foster collaboration and mutual learning, in some aspects of climate adaptation and mitigation. By grouping areas with comparable characteristics, the typologies make it easier to transfer effective solutions and best practices. They support urban planners and decision-makers in identifying relevant strategies and measures to accelerate progress in climate resilience and mitigation, offering valuable insights into the typical challenges, opportunities and key action areas within each cluster. The typologies consist of five to nine clusters each (see also "General overview of the typologies" and "Methodology").


The four typologies are: Contributions to Mitigation, Capacity for Action, Climate Hazards and Urban Morphology.


The indicators of the Urban Morphology typology are calculated exclusively based on urban areas in regions, while the indicators in the other typologies are calculated based on the entire area in the regions.


These typologies and indicator sets are four ways of grouping NUTS-3 regions (hereafter "regions") in Europe. Of course, other such typologies exist and many more are conceivable.

  • Urban Authorities and urban planners, for example to identify regions with similar characteristics based on the typology theme(s) at hand, as well as regions with challenges, opportunities and solutions
  • Regional decision-makers, for example to probe and assess a regions's profile, shared challenges, opportunities and solutions
  • Project developers, for example to adapt tools and solutions to different urban contexts
  • National- or EU-level strategic decision makers, to support scaling up solutions, by fostering targeted collaboration and encouraging knowledge-sharing and communication on solutions, especially between regions and cities sharing similar opportunities and challenges

The typologies should be used for two things, basically:

  • As guidance and orientation for typical problems, and measures to help solve them in regions in the EU
  • Finding out which of these regions are (dis-)similar in these regards


More specifically, the typologies should be used for this:

  • Finding out which and where regions are in similar situations – identifying regions which are similar to your region with respect to climate hazards, selected contributions to mitigation, urban morphology and capacity for (climate) action
  • Finding cities and regions you could be exchanging with to share problems, and solutions, and potentially collaborate
  • Orientation – for combinations of challenges, combinations of solutions and a selection of suggested adaptation measures
  • Gaining a deeper and more integrated understanding of your region in the EU – getting  a more integrated big picture of your region and how this picture relates to other places in the EU
  • Linking adaptation and mitigation
  • They must not be used in place of a city case study or local analysis – the analysis was performed on the basis of regional data only, due to data availability
  • The analysis does not replace standard, instrumental assessments for a specific region or city therein, such as a climate risk assessment
  • The cluster indicator values means must not be confused with, nor used in place of the actual indicator values of a region
How to use the map, texts and graphs for each cluster

The following building blocks of information are available for each cluster. These building blocks are precisely the information basis for the user to fulfil the purpose of each typology or cluster and for what these typologies should be used for.


Map

Each typology, and each of its clusters, can be displayed on a map. A typology can be selected by clicking on its title on the map page. Each map consists of the regions which belong to a specific cluster, as well as the clusters constituting the typology displayed. You can use the maps to answer an abundance of different questions, for example:

  • How common or rare the cluster is which the region of your interest belongs to
  • Where else you can find this cluster
  • Which regions in Europe are in similar situations to your region when it comes to each typology (the regions in the same cluster have the same color)
  • Which cities or regions you can consider exchanging and collaborating with in regards, to similar challenges, opportunities and solutions


For each typology, an interactive map visualises:

  • Spatial distribution of clusters across Europe
  • Basic cluster descriptions ("overview") for each cluster
  • Interpretation of key characteristics, in form of common challenges, opportunities and suggestions for action areas and solutions, for each cluster. In addition, for each indicator a table under "indicator values" provides a clicked region's actual values, the means of the cluster it is in and the means over all regions in the typology


These building blocks are described in the following, and clickable in the top right corner of the interactive map page.

Each cluster description begins with a basic descriptive characterisation. Use this to familiarise yourself with example cities in the regions in this cluster, urbanisation rate, cluster size, spatial distribution, basic geography, the indicator means and the cluster's most salient characteristics based on these mean values.

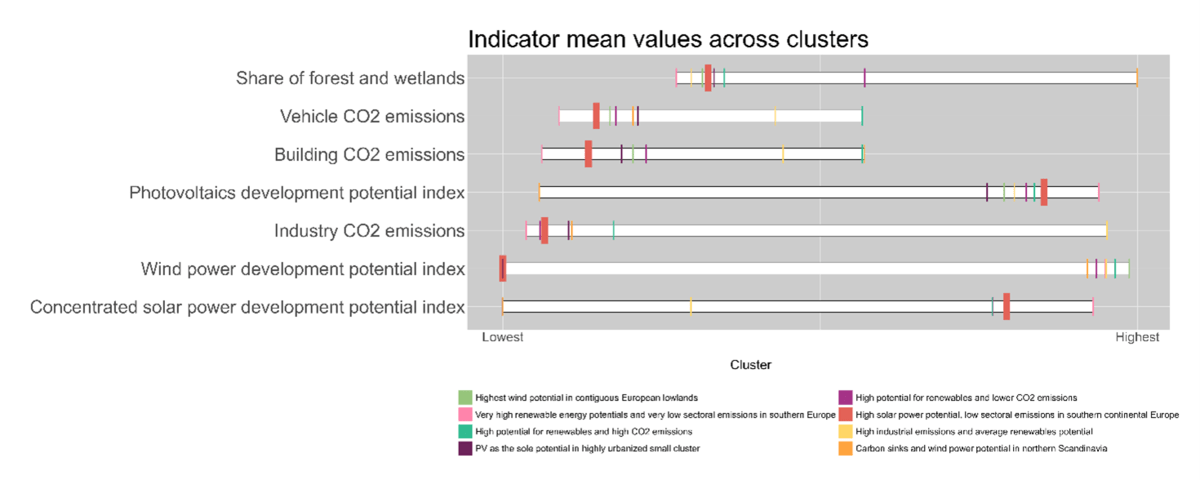
The mean indicator values for one cluster constitute a cluster's profile, i.e. its character (see Figure 1).

This plot example depicts the means of each indicator value for the cluster at hand using thick lines – in this example it is the red cluster "High solar power potential, low sectoral CO2 emissions in southern continental Europe" in the "contributions to mitigation" typology. The thin lines show the mean values in the other clusters. The white bars show the range from the lowest cluster mean to the highest for each indicator. So, the plots show the distribution of indicator mean values for all the indicators for each cluster.

Urban Typologies - Cluster profile example

Figure 1: A cluster profile example including cluster mean values for all indicators in this typology.

This allows the comparison of the characteristics and character of each cluster in a typology. For example, it shows:

  • Whether a cluster is particularly extreme for a specific indicator, as indicated by the mean value of the indicator for the cluster. This would be indicated by an especially high or low mean for an indicator.
  • Characteristic combinations of indicator averages. For example, where exposure to drought and heat is high for both indicators.
  • If some issues are particularly problematic or advantageous. This has been carefully assessed and factored into the characterisation and interpretation of each cluster. Note that an indicator does not have to be extreme to already be a problem. For example, moderate values indicating heat stress exposure are already serious problems.


Keep in mind that these are the average values for every indicator in a cluster. For any given cluster, the actual value of the indicators for the specific region in question will be in a range around the mean, and are very likely to be lower or higher than what is shown in the plot. The real indicator values for this region can be found in the "indicator values" section.

This section describes the main common challenges and opportunities based on the interpretation of the indicator values.

This text illustrates the main common areas of action for each cluster. Each action area hosts examples of highly relevant measures and instruments  –  for tackling the challenges and opportunities, as well as for using synergies and avoiding trade-offs.

For each indicator in a typology, a table provides a clicked region's actual values, the means of the cluster it is in and the means over all regions in the typology.

What are some limits and limitations?

Across the EU, NUTS-3 regions largely vary in size and urban population

Regions are not units of identical size or population across the EU. Looking at the maps on this platform, it is quickly noticeable how the regions across the EU vary quite substantially in size. For example, they are far smaller in size and greater in number in Germany than in Sweden. At the same time, (total) population per region varies. In Germany, for example, it varies between under 100,000 and above one million, for some cases.


Aggregation of indicators to NUTS-3 level and conclusions for urban areas

Due to data availability of multiple indicators, the unit of analysis is NUTS-3 and neither cities nor grid cells with a higher spatial resolution than cities. All indicators were calculated and/or aggregated to NUTS-3 level – a well-established and useful level for comparison, because political decisions are also made on this level. However, the aggregation to NUT3-units as the unit of analyses invariably provides limitations to conclusions about the urban areas therein. Here is an example: The average of PM 2.5 air pollution in urban areas in a region could be well above a WHO recommended threshold and demand action, while rural areas could be below, and result in an aggregated, moderate NUT3-average.


Some indicators were used as proxies for certain complex characteristics due to data limitations

For example, the number of hospitals per 1,000 people was employed to represent overall healthcare availability, even though this metric does not fully capture the quality, accessibility or distribution of healthcare services within a region. Such proxy indicators, while useful for comparative purposes, may oversimplify nuanced realities and potentially overlook important contextual factors. Read more about which indicators as used as proxies in the methodology document.


Limitations of specific indicators

Some indicators have specific limitations, despite being the most appropriate pick to the best of our knowledge. One example is the vulnerable age groups indicator in the capacity for action typology: The indicator has a limited definition of vulnerable groups does not include people with disabilities nor women (especially when pregnant) who also need special attention when formulation and implementing policies.


Climate Hazards typology

The indicators for this typology largely focus on exposure of people to specific climate hazards. However, the study does not investigate overall climate risk. To do so, it would be necessary to analyse vulnerability, adaptive capacity and link all four. This would have been beyond the scope of the study. For each hazards, only one indicator was used. Each one respectively indicates, for example,  exposure or hazard. In addition, the indicators focus on data on current or recently observed hazards. However, there is an exception, namely the wildfire indicator, which used climate projections based on the RCP 8.5 scenario for the time range 2070-2100.

  • Cluster A set of NUTS-3 regions with similar characteristics
  • Typology The outcome of a cluster analysis, grouping regions with shared features
  • Cluster Objects The specific regions analysed within the typologies (regions)
  • Indicator A measurable variable used to define Urban Typology characteristics
  • Indicator Value The numerical value of an indicator for a specific region
  • Nature-based Solution Actions to protect, sustainably manage and restore natural or modified ecosystems that address societal challenges effectively and adaptively, simultaneously providing human well-being and biodiversity benefits (IUCN, 2016)
  • Urban Heat Island The relative warmth of a city compared with surrounding rural areas, associated with heat trapping due to land use, the configuration and design of the built environment, including street layout and building size, the heat-absorbing properties of urban building materials, reduced ventilation, reduced greenery and water features and domestic and industrial heat emissions generated directly from human activities (IPCC glossary)
  • Concentrated Solar Power (CSP) Concentrating solar-thermal power (CSP) technologies can be used to generate electricity by converting energy from sunlight to power a turbine but the same basic technologies can also be used to deliver heat to a variety of industrial applications, like water desalination, enhanced oil recovery, food processing, chemical production and mineral processing (US department of Energy)